
Every commute leaves a trail — of emissions, materials, energy use, and upstream impacts.
Commuting is often viewed as a daily routine, but from a sustainability perspective, it’s far more layered. The environmental impact of how people get from point A to point B stretches well beyond fuel consumption.
Life Cycle Assessment shows that emissions from manufacturing, infrastructure, and maintenance can rival, or even exceed, what’s released on the road. That’s where the bike-versus-car comparison gets interesting.
Biking may seem cleaner, but how much cleaner is it when you account for the full life cycle? And how much does driving truly cost the environment? These aren’t just academic questions, they shape transportation planning, influence emissions targets, and push cities toward more resilient infrastructure.
In this blog post, let’s navigate through how biking and driving compare across their full life cycles, what the data reveals about long-term impact, and why commuting choices deserve more attention during National Bike Month.
How biking and driving compare across their full life cycles
When looking at environmental impact, fuel consumption only scratches the surface. Life Cycle Assessment reveals what lies beneath — the emissions, resource use, and waste tied to each stage of a commute, from manufacturing to disposal. Comparing biking and driving through this lens helps cut through assumptions and brings the full environmental story into focus.
A bicycle’s footprint starts small and stays that way. Materials are minimal, energy use is human-powered, and maintenance is light. Cars, by contrast, require resource-intensive manufacturing, constant fuel input, and complex upkeep. Even before the first commute, the environmental gap is already wide.

Why compare commuting methods using Life Cycle Assessment
Comparing the environmental impact of biking versus driving means looking far beyond the tailpipe. Life Cycle Assessment maps out the full picture, from raw material extraction and manufacturing, to daily use, infrastructure needs, and end-of-life. This method connects dots that are easy to miss.
For commuting, that perspective matters. A car and a bicycle don’t just differ in emissions; they represent fundamentally different systems, for example, energy intensity, resource use, urban space, and long-term environmental burden.
What data reveals about long-term impact
When comparing commuting methods, short-term savings often steal the spotlight. But Life Cycle Assessment shows the long game tells a different story; one that traces emissions and resource use across years, not just trips. So what happens when we follow the full trail of biking and driving?
- Annual CO₂ emissions reduction: An individual who replaces one car trip per day with cycling for 200 days a year can reduce mobility-related lifecycle emissions by approximately 0.5 tonnes annually.
- Lifecycle emissions comparison: Cycling contributes about 1% of the total daily mobility-related emissions in urban settings, whereas car travel accounts for around 70%.
- Energy efficiency: Electric bicycles are 18 times more energy-efficient than SUVs, 13 times more efficient than sedans, and six times more efficient than rail transit.
- Carbon offset threshold: The carbon footprint of manufacturing a bicycle is approximately 530 pounds of CO₂, which can be offset by cycling about 400 miles instead of driving.
- Urban air quality improvement: Replacing car trips with cycling can significantly reduce urban air and noise pollution, leading to improved public health outcomes.
Over a 10-year span, biking produces up to 30 times fewer greenhouse gas emissions per commuter than driving a typical gas-powered car. That figure includes bike production, maintenance, and end-of-life. Cars, by contrast, accumulate emissions daily, from fuel, wear-and-tear, and upstream energy use.
Why commuting choices deserve more attention during National Bike Month
Commuting decisions often fly under the radar in sustainability planning, yet their long-term impact adds up faster than most realize. National Bike Month, promoted by the League of American Bicyclists, creates space to rethink routines, not just celebrate cyclists. It’s a moment to examine how commuting fits into broader environmental goals and how Life Cycle Assessment reveals deeper insights beyond tailpipe emissions.
Biking to work doesn’t just cut carbon at the source. It avoids upstream impacts tied to fuel extraction, vehicle production, and road expansion. When professionals reframe commuting as a daily emissions strategy, and not just a personal preference, biking becomes a quiet force for systemic change.
Why how we commute matters more than we think
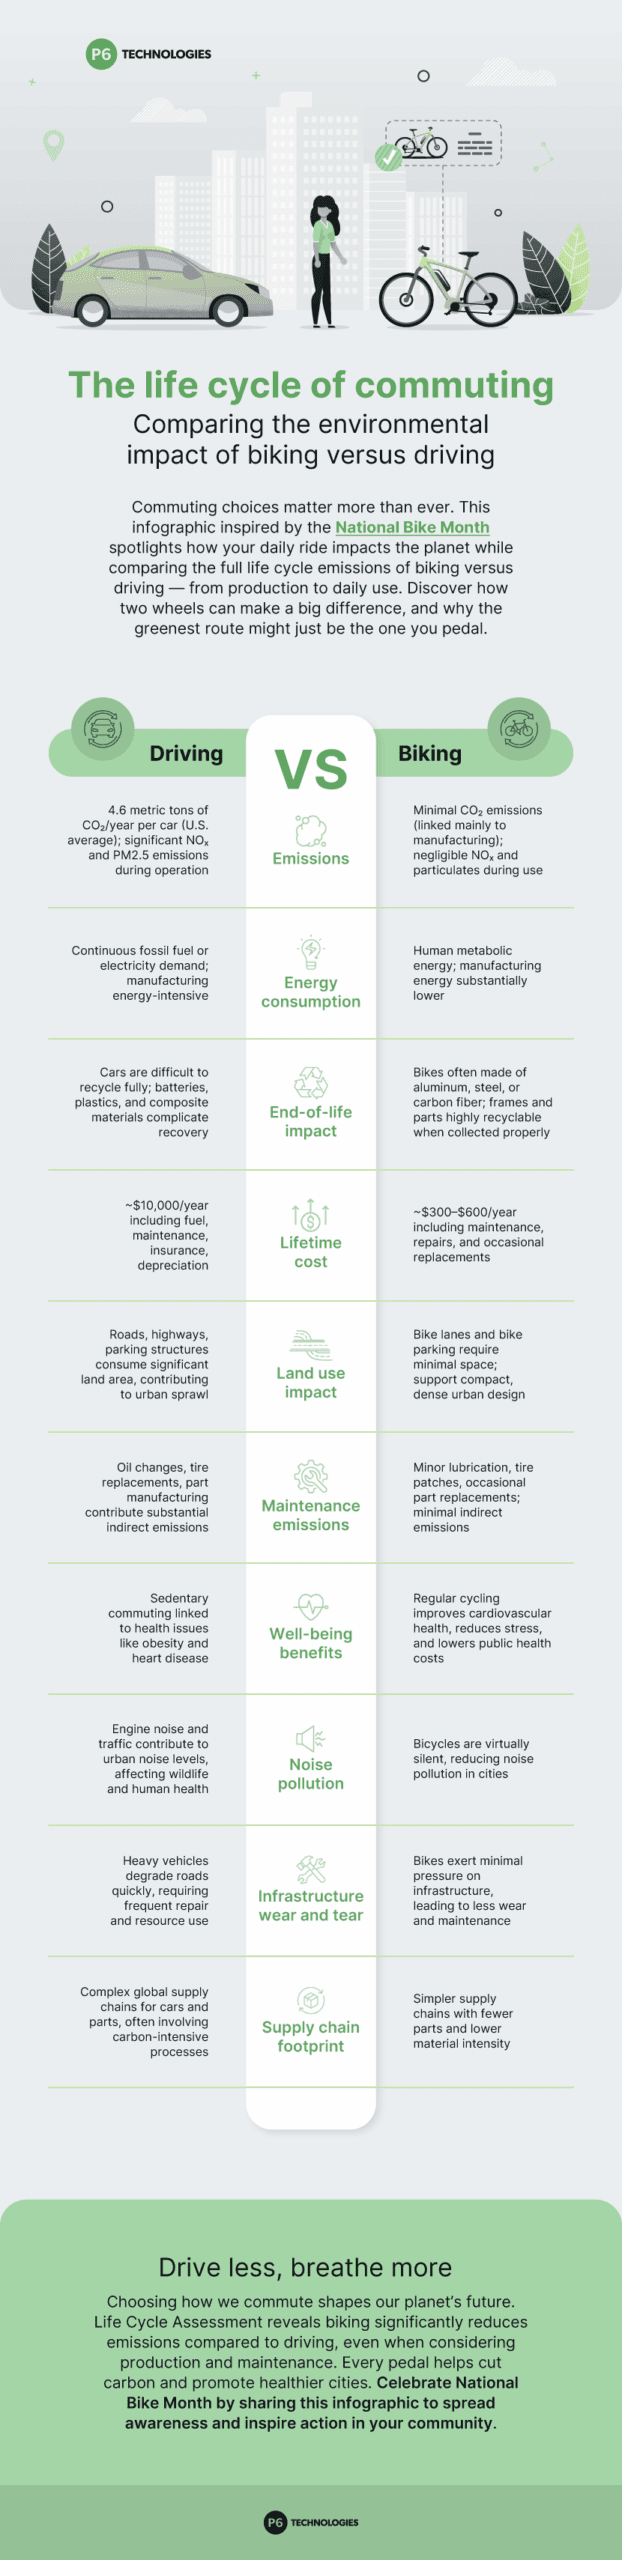
The environmental cost of commuting stretches far beyond fuel. Life Cycle Assessment shows that biking consistently outperforms driving, not just in emissions during use, but across manufacturing, infrastructure, and end-of-life stages.
Cars demand more energy, more materials, and more land. Biking is lighter, cleaner, and often overlooked in corporate sustainability strategies. As cities rethink mobility, the data is clear: small daily choices scale up fast.
This National Bike Month, shift the conversation. Share the Life Cycle of Commuting: Comparing the environmental impact of biking versus driving infographic and help move the industry — and your community — forward.


![[INFOGRAPHIC] 5 sustainability takeaways from WALL-E](https://p6technologies.com/wp-content/uploads/2025/02/wall-e_1080x500.jpg)