LCA helps organizations analyze a product’s environmental effects systematically from raw material extraction to final disposal, and the Life Cycle Assessment stages are the foundations of every detailed environmental evaluation.
The 4 stages of LCA function as interconnected phases, and ISO 14040 and ISO 14044 standards guide these phases to ensure credible and consistent assessments. Each phase of life cycle assessment reveals opportunities for improvement and helps businesses make informed decisions that improve sustainability.
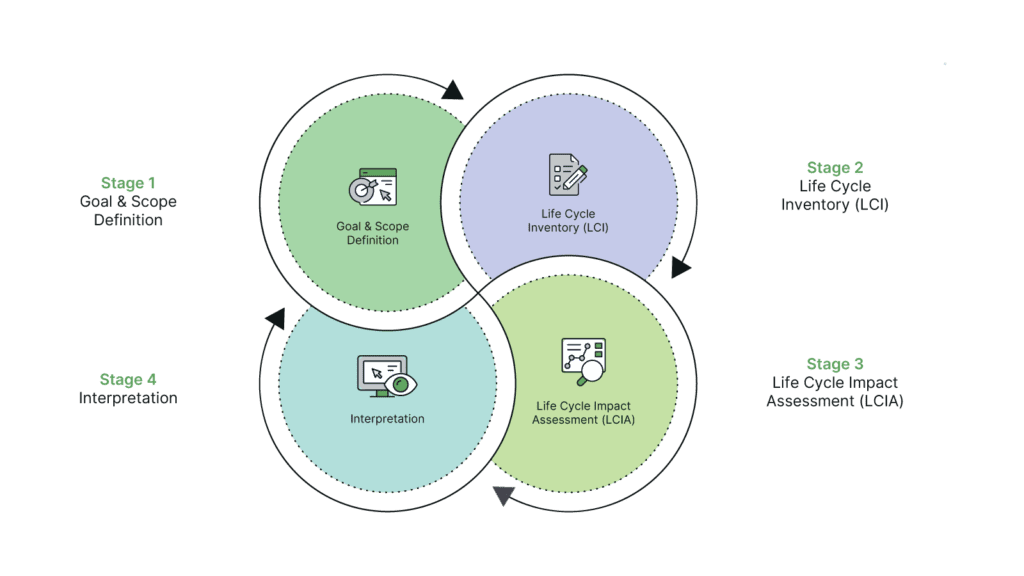
The four main stages include Goal & Scope Definition, Life Cycle Inventory (LCI), Life Cycle Impact Assessment (LCIA), and Interpretation. These phases generate meaningful data that optimizes decision-making and ensures regulatory compliance.
Understanding the fundamentals of Life Cycle Assessment stages
Life Cycle Assessment follows a systematic framework with strict guidelines. The International Organization for Standardization (ISO) sets these guidelines through ISO 14040 and 14044. These standards give a well-laid-out approach that makes complex processes easier to manage and focus on.
What defines each phase of LCA?
Each LCA phase has its own purpose that adds to the complete assessment. The Goal and Scope Definition phase sets clear objectives, system boundaries, and functional units. The Life Cycle Inventory Analysis phase collects detailed environmental input and output data. The Impact Assessment phase assesses potential environmental effects, and the Interpretation phase verifies conclusions to line up with the original objectives.
Key principles behind the 4 stages of LCA
These core principles guide the LCA stages:
- A systematic way to assess environmental impact
- Requirements for data quality and verification
- Clear methodology and results
- Refinements through iteration
- Standard assessment procedures
These principles help keep LCAs consistent, credible, and comparable across studies. The method focuses on complete data collection and verification at every stage.
How the LCA stages interconnect
LCA stages connect to create a dynamic assessment process. Changes in one stage directly affect the outcomes of later phases. The interpretation phase stays active throughout the assessment and allows continuous refinement and optimization.
This interconnection needs careful attention to data quality and consistency. Each phase builds on information and analytical insights from previous steps. To cite an instance, inventory analysis feeds essential data into impact assessment, while interpretation guides refinements in scope and method.
Ultimately, the stages create an iterative cycle. Findings from later phases might require revisiting earlier stages to adjust or collect more data. This cycle helps the assessment stay thorough and adapt to new insights throughout the process.
Stage 1: Goal & Scope Definition — Setting the foundation
Clear parameters shape how a life cycle assessment unfolds from start to finish. The goal and scope definition stage helps us understand what we want to achieve and maps out our path forward.
Defining clear objectives and boundaries
We start by answering three basic questions: why we need this study, how we’ll put the results to work, and who needs to see them. The next step maps out system boundaries that show what’s part of our assessment and what isn’t.
Our boundary definitions take into account where things happen, what rules apply, and how consumers behave differently across regions. Beyond the technical stuff, we need good quality data to get reliable results. This means we need to know how detailed our data should be and which processes need a closer look.
Selecting functional units and reference flows
A functional unit gives us a measured description of how well the product performs. This gives us a baseline to compare different systems fairly. To name just one example, for lighting solutions, we might use “1000 hours of 1250 lumen light” as our measuring stick.
The reference flow takes this abstract unit and tells us exactly how much product we need. It shows the actual amount needed to do the job. Take cement production — if we need a strength grade of 32 MPa, the reference flow tells us exactly how much cement will get us there.
Common pitfalls and best practices
People often forget that defining goals and scope isn’t a one-time thing. As we gather data, we might need to adjust our original plan. We also need to figure out early on how to split up environmental impacts when multiple products come from the same process.
Here’s what works best:
- Document your assumptions clearly
- Keep system boundaries realistic
- Match your data quality to what you want to achieve
- Factor in differences across locations and time periods
- Set clear rules for leaving out minor inputs
These early decisions lay the groundwork for everything that follows. A solid foundation at this stage creates a reliable framework for the whole assessment process.
Stage 2: Life Cycle Inventory (LCI) — Collecting and managing data
Data collection is the life-blood of Life Cycle Inventory (LCI) and it takes the most time in life cycle assessment. This stage calculates all inputs and outputs throughout a product’s life cycle.
Essential data requirements for LCI
The LCIA phase just needs comprehensive data about environmental flows of all types. Raw materials, energy usage, and resource consumption make up the primary input flows. Output flows cover emissions to air, water, and soil, along with waste generation and product outputs. Of course, the compilation process needs detailed information about production efficiencies, equipment specifications, and travel distances.
Data sources we used mainly:
- Direct measurements and monitoring
- Literature and scientific publications
- Life cycle inventory databases
- Expert interviews and surveys
Primary vs secondary data considerations
Primary data shows directly measured information from specific facilities or processes. In fact, it has raw process data, site-specific measurements, and detailed supplier information. Primary data collection uses more resources but delivers higher accuracy and specificity for the assessment.
Secondary data comes from existing scientific databases and published research. This data fills gaps when primary data collection becomes impractical or too expensive. The Life Cycle Inventory database, especially EcoInvent, provides standardized background data for supply chains of all types.
Quality assurance in data collection
Quality assurance in LCI needs careful attention to several vital aspects. Data quality indicators (DQIs) help assess reliability through multiple criteria that include completeness, temporal correlation, and geographical representation. Clear data quality goals become essential to maintain assessment credibility.
The quality assessment process has three significant steps:
- Internal review of individual datasets
- Industry experts’ involvement
- Third-party verification of data integrity
Errors happen through measurement inaccuracies or unit conversion mistakes. Practitioners must use systematic validation procedures to maintain data integrity. These include mass and energy balances and comparative analysis of different data sources. Data reliability and reproducibility remain vital for credible LCA results.
Stage 3: Life Cycle Impact Assessment — Evaluating environmental effects
Life Cycle Impact Assessment (LCIA) turns inventory data into meaningful environmental impact indicators. This significant phase helps calculate potential effects on human health, the natural environment, and resource depletion.
Choosing impact categories
The study’s goals and scope drive the selection of impact categories. Common environmental impact categories include:
- Climate change (measured in CO2 equivalents)
- Human toxicity (cancer and non-cancer effects)
- Ozone depletion
- Acidification (measured in SO2 equivalents)
- Eutrophication
- Resource depletion
- Land use impacts
A complete LCIA looks at multiple environmental effects instead of just carbon emissions. The chosen categories should line up with the study’s objectives while keeping data availability and quality needs in mind.
Classification and characterization methods
Classification assigns inventory data to relevant impact categories, while characterization calculates how much each category contributes. Different substances that affect the same impact get converted into common units using characterization factors.
Several LCIA methods guide this process, including ReCiPe, IMPACT 2002+, and ILCD’s recommended methodologies. These methods use two main approaches: midpoint indicators that target single environmental problems, and endpoint indicators that show impacts at higher aggregation levels.
The characterization process converts emissions and resource extractions into environmental impact scores. This conversion uses scientifically proven factors that show how different substances contribute to specific environmental impacts.
Interpretation of LCIA results
Result interpretation needs careful analysis to spot significant issues and assess their reliability. Practitioners must think over data quality, completeness, and consistency before drawing conclusions.
The process looks at contributions from different life cycle stages and finds major impact drivers. Results will have some uncertainty because each aggregation step increases uncertainty levels.
A resilient interpretation needs sensitivity analysis for characterization, normalization, and weighting. Whatever method you choose, practitioners must be transparent about data quality and methodological choices. This approach will give decision-makers reliable information to develop sustainable products and improve processes.
Stage 4: Interpretation — Drawing meaningful conclusions
Data transforms into applicable information during the key interpretation stage. This final stage of life cycle assessment needs a careful review of results to line up with the study’s objectives.
Analyzing results effectively
The interpretation phase needs close attention to three key elements. Teams must verify if relevant information is complete and meets cut-off criteria. A sensitivity analysis shows how reliable the final results are, while consistency checks confirm that assumptions and methods line up throughout the study.
Dashboard-style result presentations received positive responses from most participants. About 86% preferred this format to visualize data. Visual comparisons worked better when the study had clear goals.
Identifying improvement opportunities
Contribution analysis helps find processes, materials, or life cycle stages that create the biggest effects. This analysis helps teams focus on areas that could improve environmental performance the most.
Teams should think over these points to improve analysis:
- Trade-offs between different environmental impacts
- Data uncertainty and variability
- Technological alternatives
- Location and time factors
Missing data uncertainty explanations can hurt how well audiences understand. Results need to balance good visualization with complex data. This balance is vital since LCA result trade-offs put much responsibility on end-users to make effective decisions.
Communicating findings to stakeholders
The way teams present LCA results affects how audiences interpret them. A good communication strategy needs three vital aspects:
Visualization techniques should match the audience’s technical knowledge. Dashboards show “high potential” to summarize results in LCA research and consulting. Clear documentation of uncertainty and limitations prevents misconceptions. The presentation needs to stay simple yet technically sound.
Teams must ensure their visuals for comparisons and hotspot identification send the right message. The right presentation format helps understanding without losing scientific accuracy. Grid layouts work best with clear macro trends that justify grouping or when space is limited.
The interpretation phase does more than analyze — it creates a path to environmental improvement. Teams can make meaningful conclusions that drive sustainable decisions by checking completeness, sensitivity, and consistency.
Ready to navigate these LCA stages?
Life Cycle Assessment stages offer a well-laid-out way to learn about and improve environmental effects throughout a product’s lifecycle. These stages build on each other and create a detailed framework that helps make environmentally responsible decisions.
The systematic nature of LCA just needs you to pay close attention to detail. You must set clear objectives, collect quality data and evaluate environmental effects. Becoming skilled at these stages helps businesses make smart choices about their environmental impact and meet regulatory requirements.
Life cycle assessment software can change the way you handle life cycle assessment. It makes the complex process easier to manage and evidence-based. On top of that, it helps organizations spot ways to improve and optimize their environmental performance.
LCA ended up being a powerful tool for sustainable development. A careful look at each stage and proper interpretation of results can improve environmental performance while keeping business efficiency high. The key to getting reliable, practical insights lies in really understanding these stages and applying them systematically.
Now that you are mastering all the phases of Life Cycle Assessment, how about discovering how LCA software can transform the way you navigate the LCA stages?